Skip to content
Blog

The art of (mis)loading deliveries

Publication: Goods Movement 2030, an Urban Freight Blog
Publication Date: 2024
Summary:

Imagine the frustration of searching for a misplaced item, like your house keys or wallet, before leaving for a night out. Now, picture a FedEx or Amazon delivery driver halfway through a tight morning route, struggling to locate a parcel due by 9 a.m. while parked right outside the customer’s address.

These misloads — where shipments are accidentally loaded onto the wrong delivery route or vehicle — not only cause stress and lost time for the delivery driver but also result in significant negative economic and environmental impacts. Misloads can also lead to customer dissatisfaction, erode trust in the delivery company, and necessitate additional vehicle travel miles to rectify the mistake. Despite this, little is known about the frequency of human errors in last-mile delivery and how they affect the overall supply chain. In this post, we define the concept of misloading and unpack some of these questions to better understand its implications and identify potential solutions.

What is misloading?

Misloading is generally considered an error in the Load Planning Problem (LPP). An LPP is a discrete optimization problem that considers a logistic network structure (set of nodes, or logistics terminals, and links, routes connecting terminals served by a given fleet of trucks) and the demand for freight (quantity, origin, and destination). The objective is to determine the optimal sequence of terminals that a load of freight should traverse to minimize handling costs and maintain a specified level of service. The outcome of an LPP is a “load plan,” which details a unique strategy to handle each shipment at every point in the system (Powell & Sheffi, 1983).

A shipment misload is a deviation from the load plan, which could occur due to intentional or unintentional actions. For example, during a ridealong I performed on a parcel delivery route in downtown Seattle (Dalla Chiara et al., 2020), the driver chose to deliver a bulky carpet earlier in the morning instead of the afternoon ahead of schedule in the morning rather than the afternoon, in order to create space inside the vehicle to safely and efficiently move around and retrieve packages from the shelves. Such intended deviation from the load plan improved the efficiency of the overall route. Conversely, unintended misloads often occur due to human errors (a shipment is misplaced on the wrong vehicle or route) or machine errors (a shipment is incorrectly labeled).

Based on the stage in the supply chain where they occur, misloads can also be classified as hub-to-hub or preload misload. Hub-to-hub misloading occurs when the mis-shipment is during a package transfer between two depots (for example, a package mistakenly sent to Vancouver, B.C., Canada, instead of Vancouver, WA, USA). Preload misloading happens at the last-mile facility — the last leg of a supply chain, where shipments are scanned, sorted, and loaded into delivery vehicles either by a driver or a preloader. At this stage, the a shipment may be placed on the wrong route, either due to human or upstream label errors.

Frequency of misloaded packages

Misloading is often reported as a misloading rate (or its corresponding order accuracy rate) calculated by dividing the number of misloads by the total number of deliveries during a given time period.

The misload rate varies across industry sector, leg of the supply chain (whether hub-to-hub or preload), and even geographical location of logistics facilities. In the fast-moving goods sector, hub-to-hub misloads rate are reported to range from 0.01% to 0.1%, while preload misload rates have been reported between 0.1% and 0.3%.

While this may seem relatively small, misloading occurs daily due to the vast scale of delivery operations. For example, with a 0.2% misload rate, approximately one in 500 parcels is misloaded. Considering that a typical parcel delivery van handles around 250 packages per route, on average, every two vehicles would contain one misloaded package. Even with a lower misload rate of 0.1% (one in 1,000 packages), there would still be one misloaded package for every four delivery vehicles. In Seattle, where approximately 900 parcel delivery vehicles enter the greater downtown area daily (Giron-Valderrama & Goodchild, 2020), this equates to more than 200 misloaded packages every day. These figures highlight the frequency of misloading incidents despite their seemingly low percentage, and underscore the impact on operational efficiency and customer service.

We note that the misload rate increases the closer we get to the last mile of a delivery journey in the fast-moving consumer goods sector. From the data above, the misload rate quadrupled from the hub-to-hub to the last-mile segment (from 0.05% to 0.2%). This reflects increased manual labor, reduced automation, and increased complexity in handling smaller, non-standard parcels.

Quantifying the impact of misloading

Quantifying the economic and environmental loss of a misloaded package involves first understanding how drivers respond to these errors.


A preload misload is typically identified when a driver has either a missing package they are supposed to deliver or an additional package that does not belong on their assigned route. What happens next will depend on procedures implemented by the facility and other operational factors. In the case of a missing package deemed “critical,” the driver would typically alert nearby routes where the misloaded package is likely to have been placed). The driver might meet the other driver halfway, or the other driver may make the additional delivery. A “non-critical” package may be returned to the facility and rescheduled for delivery the following day. In either case, misloads result in additional miles traveled and the loss of driver time.

Quantifying the negative impacts of misloading is a difficult task. Transportation science often uses simulation tools to test different scenarios that are difficult to measure empirically by generating mathematical models. In this case, a misloading simulator takes as input the existing delivery demand and misload rate, calculates the optimal load plan, and outputs the total vehicle miles traveled (VMT) and total route time under scenarios both with and without misloads. By running simulations with varying parameters (different demands and misload rates), the misload simulator can provide a sufficiently precise estimate of how the misloads affects route performance.

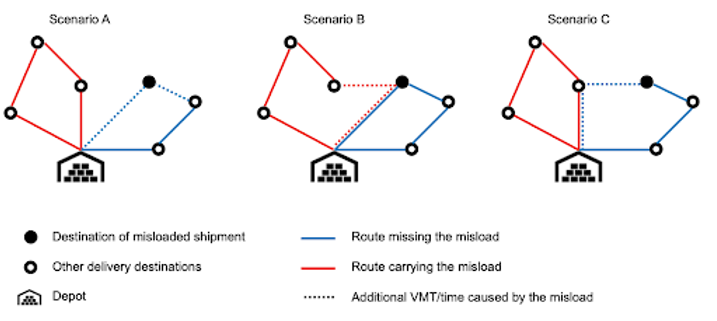
According to the previous section, misloading can cause three possible scenarios, depicted in the figure below. In all three scenarios, we identified two routes — the red route carrying the misloaded shipment, the blue route missing the misloaded shipment — and the full node representing the final destination of the misloaded shipment.

  • Scenario A simulates the case of a misloaded non-critical package; in this scenario, the impact of misload is the additional VMT and time the driver spends on the blue route to reach the customer without being able to complete the delivery, as the shipment was misloaded on the vehicle carrying out the red route.
  • Scenario B simulates the case of a misloaded critical package, where the driver of the red route is required to spend extra time and VMT to make an additional delivery.
  • Scenario C simulates the case of a misloaded critical package, in which the driver of the blue route needs to spend additional time and VMT to meet the driver on the red route and retrieve the misloaded package.

The shape and length of delivery routes are extremely heterogeneous and vary among carriers, business sectors, and contexts. For instance, if we consider the case of a typical parcel delivery carrier delivering in downtown Seattle, a route averages 7.2 miles, with 24 stops, and an average distance of 0.3 miles per stop. A beverage company delivering in downtown Seattle typically has a 15-mile route with 11 stops and an average of 1.4 miles per stop (Dalla Chiara et al., 2021). Considering the simplest scenario to simulate (scenario A) and assuming the above-discussed misload rate of one misloaded shipment every two routes, a single misload would result in an additional 0.6 miles of travel, representing 4% of the total VMT. In the case of the beverage distributor, a single misload would leads to an additional 2.8 miles traveled, constituting 9% of total VMT.

Addressing misloading

Despite their statistical infrequency, misloads occur daily, affecting delivery times, increasing VMT, and eroding customer trust. Delivery companies strive to meet and exceed their misload target rates, but often struggle to identify effective solutions.

Addressing misloads involves a multifaceted approach that combines improved training and the adoption of advanced technologies. Developing clear procedures and providing training for drivers and preloaders can reduce human errors in labeling, sorting, scanning, and loading, as well as in detecting and correcting misloads. The Service Awareness Label Training (SALT) practice helps improve error detection. SALT involves placing fake misloaded packages in the system to assess employees’ ability to identify them.

Recent advancements in tracking technologies are creating new opportunities for delivery companies to reduce misloading. Since the introduction of scanning (the first item marked with a Universal Product Code was scanned in 1974 in a supermarket in Troy, OH, Weightman, 2015), most parcels are now scanned at key checkpoints, reducing human errors, generating a wealth of data that can be used to optimize the supply chain, and providing customers with real-time location and status information about their parcels.

Radio-frequency identification (RFID) technology, which allows multiple simultaneous scans, has allowed for substantial efficiency gains throughout the supply chain (Fan et al., 2015), enabling seamless tracking and reducing manual effort. While cost has historically been a major obstacle to full deployment (Bottani and Rizzi, 2008), 2022 seemed to be a tipping point in RFID implementation at scale (Swedberg, 2022). For instance, UPS launched a smart package initiative starting in 2022, deploying an RFID-based system through its facilities (Garland, 2022). The system involves placing RFID scanners on wearable devices and on delivery vehicle rear doors to automate preloading and eliminate manual scanning — and, therefore, the likelihood of misloads. Also beginning in September 2022, global retailer Walmart mandated that suppliers across several departments include RFID tags on all products shipped to its warehouses.

What’s next?

While the impact of misloading has been viewed mostly from a customer service perspective, its broader economic and environmental impacts are often overlooked. Implementing technologies like RFID can reduce misload rates, yet companies must weigh the cost and benefits of such investments. Quantifying the benefits of reducing misloads, such as decreasing VMT, lowering vehicle emissions, and improving drivers’ efficiency (among other potential efficiencies, for instance, Brewster, 2024) is important to guide companies in making informed decisions and optimize strategies.

Acknowledgements

The author would like to acknowledge IMPINJ for their technical and financial support and the experts and practitioners who provided content for this article.

References

Presentation

Resilience of Maritime Transport for Emergency Response Following an Earthquake

Publication: Canadian Transport Research Forum Conference (CTRF) 56th Annual Conference - Ensuring Resilience in Transportation Systems: Anticipating and Responding to Pandemic, Climate, Demographic and Economic Changes
Publication Date: 2021
Summary:

Following an earthquake, coastal and island communities may need to rely primarily on maritime transport for regular and critical supplies during the emergency response phase. However, such a disaster may also disrupt the needed transport activities in several ways, including damage to critical infrastructure (CI) such as ports and roads. The Strategic Planning for Coastal Community Resilience to Marine Transportation Disruption (SIREN) project, comprising teams from four universities, was established with the support of EMBC (Emergency Management British Columbia) and the MEOPAR NCE (Marine Environmental Observation, Prediction and Response – Network of Centres of Excellence) to explore resilience strategies and response options through the development and application of a suite of models. This brief article serves to summarize this broad initiative, relegating the details to other more technical publications under development by the team.


Authors: Dr. Anne Goodchild, Ronald Pelot, Floris Goerlandt, Stephanie Chang, David Bristow, Cheng Lin, Lina Zhou
Recommended Citation:
Pelot, Ronald, Floris Goerlandt, Stephanie Chang, David Bristow, Cheng Lin, Lina Zhou, and Anne Goodchild. "Resilience of Maritime Transport for Emergency Response Following an Earthquake." In CTRF 56th Annual Conference-Ensuring Resilience in Transportation Systems: Anticipating and Responding to Pandemic, Climate, Demographic and Economic Changes. 2021.

Dr. Giacomo Dalla Chiara

Dr. Giacomo Dalla Chiara
  • Research Associate, Urban Freight Lab
giacomod@uw.edu  |  206-685-0567  |  Wilson Ceramics Lab 111
  • Urban transportation
  • Urban logistics
  • Operations research
  • Effectiveness of ebikes for last-mile delivery
  • Ph.D., Engineering Systems and Design, Singapore University of Technology and Design (SUTD) (2018)
    Dissertation: Commercial Vehicles Parking in Congested Urban Areas
  • M.S., Statistics, Swiss Federal Institute of Technology (ETH) (2012)
    Thesis: Factor Approach to Forecasting with High-Dimensional Data
  • B.S., Economics and Business, Libera Università Internazionale degli Studi Sociali (LUISS) (2010)
    Thesis: A Monopolistic State in Competitive Markets

Dr. Giacomo Dalla Chiara is a Post-Doctoral Research Associate at the Urban Freight Lab. Before moving to Seattle, he was postdoctoral research fellow at the Singapore University of Technology and Design in 2018 and visiting scholar at the Massachusetts Institute of Technology in 2017. He holds a PhD in Engineering Systems from the Singapore University of Technology and Design (Singapore), a MSc in Statistics from ETH Zurich (Switzerland) and a BSc in Economics from LUISS University (Italy).

His research focuses on statistical methods applied to urban mobility problems. His work involves developing models and simulations to study and develop new sustainable urban logistics practices.

  • Guest Editor, Transportation Research Part A: Policy and Practice (Elsevier) (2021)

Dr. Ed McCormack

Dr. Ed McCormack
Dr. Ed McCormack
  • Research Associate Professor, Civil and Environmental Engineering
  • Washington State Transportation Center (TRAC)
  • Director, Sustainable Transportation Master's degree program
edm@uw.edu  |  206-543-3348  |  Wilson Ceramics Lab 108
  • Freight Mobility in Urban Areas
  • Transportation Technology Evaluation
  • Freight Systems Performance Measurement

Dr. Ed McCormack’s research program is broadly around the theme of the use of technology to improve mobility for people and goods. Improved data storage, wireless communications, and faster computers have created new streams of high quality transportation information. This information allows operators and the public to be more strategic and efficient about using our transportation system but also requires new thinking and innovative approaches. Given the belief in our society that technology can solve many problems, one challenge that he frequently addresses in his research is elemental: what works? For example, his research has evaluated the application and usability of different in-vehicle tracking technologies and of freight-oriented traveler information systems.

A second topic of importance is his recent research—derived from his interest in technology—that explores the development of quantitative tools that can use streaming data. Many of his projects have used these data to create performance measures that allow the monitoring of vehicle travel activity and the calculation of metrics that support engineering and planning decisions.

He has increasingly focused on freight mobility. Despite freight’s obvious importance to our society, this area of transportation has traditionally been understudied by academics, particularly in comparison to people transportation. As a researcher, he has found that there are opportunities to provide innovative insights in this area.

  • Faculty Appreciation for Career Education & Training (FACET) Award for mentoring of students (2020)
  • Ph.D., Geography, University of Washington (1997)
    Dissertation: A Chained-Based Exploration of Work Travel by Residents of Mixed Land-Use Neighborhoods
  • M.S., Civil Engineering, University of Washington (1985)
    Thesis: An Examination of Transit’s Work-Share Using Census Journey–to-Work and Transit On-Board Survey Data
  • B.S.E., Geography, University of Washington (1979)

Dr. Ed McCormack is an international leader in truck GPS data applications for freight performance measurement, and technology that facilitates truck flows along roadways and through border crossings and marine ports. He developed methods for the Washington State Department of Transportation and the Norwegian government to measure truck speed and reliability performance on highways and roads through the analysis of truck GPS data. He recently served as the Chief Engineer in the ITS section of the Norwegian Public Roads Administration.

He holds a PhD in Geography, MS in Civil Engineering, and a BA in Geography—all from the University of Washington. Before working at UW, he was an engineering consultant with David Evans and Associates and a transportation planner with both King County and the Puget Sound Regional Councils.

Dr. McCormack has worked on National Academy of Sciences Transportation Research Board (TRB) projects to identify and improve truck bottlenecks, incorporate smart growth principles into freight forecasting tools, and help public agencies obtain freight data and turn it into valuable information.

He is an independent evaluator for U.S. Department of Transportation freight technology projects, including those addressing truck queuing and congestion. He is directs and teaches in the Sustainable Transportation Master’s degree program and Livable Communities certificate program.

  • Professor (II), Department of Civil and Transport Engineering, Norwegian University of Science and Technology
  • Adjunct Research Associate Professor, Urban Design and Planning, University of Washington
Paper

Estimating Intermodal Transfer Barriers to Light Rail using Smartcard Data in Seattle, WA

 
Download PDF  (2.90 MB)
Publication:  Transportation Research Record: Journal of the Transportation Research Board
Publication Date: 2022
Summary:

Transit transfers are a necessary inconvenience to riders. They support strong hierarchical networks by connecting various local, regional, and express lines through a variety of modes. This is true in Seattle, where many lines were redrawn to feed into the Link Light Rail network. Previous transfer studies, using surveys, found that perceived safety, distance, and personal health were significant predictors of transfers. This study aims to use smartcard data and generalized linear modeling to estimate which elements of transfers are commonly overcome—and which are not—among riders boarding the Link Light Rail in Seattle and its suburbs. The aims of this research are twofold: (1) critical analysis of attributes of transfer barriers so that the future station area could serve improved riders’ accessibility; (2) equity of transfer barriers among the users by analyzing the user breakdown of the origin lines and the destination. We use Seattle’s One Regional Card for All smartcard data among the Link Light Rail riders in the Seattle metropolitan area in 2019, and applied a negative binomial generalized linear model. The model suggests that walking distance and walking grade have significant effects on transfers. For the users’ equity analysis, the disabled population tends to transfer less, while the low-income and youth riders populations tend to transfer more often. Future research could incorporate a more mixed-methods approach to confirm some of these findings or include station amenities, such as live schedule updates for common transfer lines.

Authors: Dr. Ed McCormack, James Eager (University of Washington Department of Urban Design and Planning), Chang-Hee Christine Bae (University of Washington Department of Urban Design and Planning)
Recommended Citation:
Eager, J., Bae, C.-H. C., & McCormack, E. D. (2022). Estimating Intermodal Transfer Barriers to Light Rail using Smartcard Data in Seattle, WA. Transportation Research Record. https://doi.org/10.1177/03611981221119190.
Technical Report

Field Test of Unmanned Aircraft Systems (UAS) to Support Avalanche Monitoring

 
Download PDF  (9.36 MB)
Publication: Norwegian Public Roads Administration Report
Volume: Geohazard Survey from Air (GEOSFAIR)
Publication Date: 2022
Summary:

The Norwegian Public Roads Administration, the Norwegian Geotechnical Institute, and SINTEF conducted a field test with a unmanned aerial system (UAS) with various instruments at the research station Fonnbu in Stryn. The purpose of the test was to evaluate the use of instrumented drones for monitoring and assessing avalanche danger. The instruments tested included optical and thermal imaging, laser scanning and ground-penetrating radar. Resulting datasets included 3D models (point clouds and height maps), multispectral and radiometric, thermal images and radargrams.

Authors: Dr. Ed McCormack, Regula Frauenfelder, Sean Salazar, Halgeir Dahle, Tore Humstad, Emil Solbakken, Trine Kirkhus, Richard Moore, Bastien Dupuy, Pauline Lorand
Paper

Toward Predicting Stay Time for Private Car Users: A RNN-NALU Approach

 
Download PDF  (1.94 MB)
Publication: IEEE Transactions on Vehicular Technology
Volume: 71 (6)
Pages: 6007 - 6018
Publication Date: 2022
Summary:

Predicting the stay time of private cars has various applications in location-based services and traffic management. Due to the associated randomness and uncertainty, achieving the promising performance of stay time prediction is a challenge. We propose an RNN-based encoder model to solve this problem, which consists of three components, i.e., an encoder module, an exception module, and an MLP dropout. First, we encode the stay behaviour into hidden vectors at a specific time to avoid the effect of time sparsity. The encoder module utilizes a multilayer perceptron (MLP) to learn spatiotemporal features from the historical trajectory data, such as the inherent relationship between the stop points and corresponding stay time. We proved a linear relationship problem that cannot be ignored in the stay time prediction problem. In particular, we have added basic arithmetic logic units to the network framework to find linear relationships. By reconstructing the basic arithmetic and logical relations of the network, we have improved the ability of the neural network to handle linear relations and the extrapolation ability of the neural network. Our method can remember the number patterns seen in the training set very well and infer this representation reasonably. Moreover, we utilize the dropout technique to prevent the prediction model from overfitting. We perform extensive experiments based on a large-scale real-world private car trajectory dataset. The experimental results demonstrate that our method achieves an RMSE of 0.1429 and a MAPE of 55.8533%. Furthermore, the results verify the effectiveness and advantages of the proposed model when compared with the benchmarks.

Authors: Amelia Regan, Qibo Zhang; Fanzi Zeng; Zhu Xiao; Hongbo Jiang; Kehua Yang; Yongdong Zhu
Recommended Citation:
Q. Zhang et al., "Toward Predicting Stay Time for Private Car Users: A RNN-NALU Approach," in IEEE Transactions on Vehicular Technology, vol. 71, no. 6, pp. 6007-6018, June 2022, doi: 10.1109/TVT.2022.3164978.
Article

Local Area Routes for Vehicle Routing Problems

 
Download PDF  (1.44 MB)
Publication: arXiv
Publication Date: 2022
Summary:
In this research we consider an approach for improving the efficiency and tightness of column generation (CG) methods for solving vehicle routing problems. This work builds upon recent work on Local Area (LA) routes. LA routes rely on pre-computing (prior to any call to pricing during CG) the lowest cost elementary sub-route (called an LA arc) for each tuple consisting of the following: (1) a customer to begin the LA arc, (2) a customer to end the LA arc, which is far from the first customer, (3) a small set of intermediate customers nearby the first customer. LA routes are constructed by concatenating LA arcs where the final customer in a given LA arc is the first customer in the subsequent LA arc. A Decremental State Space Relaxation (DSSR) method is used to construct the lowest reduced cost elementary route during the pricing step of CG. We demonstrate that LA route based solvers can be used to efficiently tighten the standard set cover vehicle routing relaxation using a variant of subset row inequalities (SRI). However, SRI are difficult to use in practice as they alter the structure of the pricing problem in a manner that makes pricing difficult. SRI in their simplest form state that the number of routes servicing two or three members of a given set of three customers cannot exceed one. We introduce LA-SRI, which in their simplest form state that the number of LA arcs (in routes in the solution) including two or more members of a set of three customers (excluding the final customer of the arc) cannot exceed one. We exploit the structure of LA arcs inside a Graph Generation based formulation to accelerate convergence of CG. We apply our LA-SRI to CVRP and demonstrate that we tighten the LP relaxation, often making it equal to the optimal integer solution, and solve the LP efficiently without altering the structure of the pricing problem.


Authors: Amelia Regan, Udayan Mandal, Julian Yarkony
Recommended Citation:
Mandal, U., Regan, A., & Yarkony, J. (2022). Local Area Subset Row Inequalities for Efficient Exact Vehicle Routing. arXiv preprint arXiv:2209.12963.
Paper

4D Flight Trajectory Prediction using a Hybrid Deep Learning Prediction Method Based on ADS-B Technology: A Case Study of Hartsfield–Jackson Atlanta International Airport (ATL)

 
Download PDF  (1.56 MB)
Publication: Transportation Research Part C: Emerging Technologies
Volume: 144
Publication Date: 2022
Summary:

At the core of any flight schedule is the four dimensional (4D) trajectories which are comprised of three spatial dimensions with time added as the fourth dimension. Each trajectory contains spatial and temporal features that are associated with uncertainties that make the prediction process complex. Because of the increasing demand for air transportation, airports and airlines must have optimized schedules to best use the airports’ infrastructure potential. This is possible using advanced trajectory prediction methods. This paper proposes a novel hybrid deep learning model to extract spatial and temporal features considering the uncertainty for Hartsfield–Jackson

Atlanta International Airport (ATL). Automatic Dependent Surveillance-Broadcast (ADS–B) with a vast amount of spatial and temporal flight attribute data, are used in this paper as input to the models. This research is conducted in three steps: (a) data preprocessing; (b) prediction by a hybrid Convolutional Neural Network and Gated Recurrent Unit (CNN-GRU) along with a three dimensional (3D-CNN) model; (c) The third and last step is the comparison of the model’s performance with the proposed model by examining the experimental results. The deep model uncertainty is considered using Mont-Carlo dropout (MC-Dropout). Mont-Carlo dropouts are added

to the network layers to enhance the model’s prediction performance by a robust approach of switching off between different neurons. The results show that the proposed model has low error measurements compared to the other models (i.e., 3D CNN, CNN-GRU). The model with MCdropout reduces the error further by an average of 21 %.

Authors: Amelia Regan, Hesam Shafienya
Recommended Citation:
Shafienya, H., & Regan, A. C. (2022). 4D flight trajectory prediction using a hybrid Deep Learning prediction method based on ADS-B technology: A case study of Hartsfield–Jackson Atlanta International Airport (ATL). Transportation Research Part C: Emerging Technologies, 144, 103878. https://doi.org/10.1016/j.trc.2022.103878
Article

Local Area Subset Row Inequalities for Efficient Exact Vehicle Routing

 
Download PDF  (1.44 MB)
Publication:  arXiv e-prints (2022): arXiv-2209
Publication Date: 2022
Summary:
In this research we consider an approach for improving the efficiency and tightness of column generation (CG) methods for solving vehicle routing problems. This work builds upon recent work on Local Area (LA) routes. LA routes rely on pre-computing (prior to any call to pricing during CG) the lowest cost elementary sub-route (called an LA arc) for each tuple consisting of the following: (1) a customer to begin the LA arc, (2) a customer to end the LA arc, which is far from the first customer, (3) a small set of intermediate customers nearby the first customer. LA routes are constructed by concatenating LA arcs where the final customer in a given LA arc is the first customer in the subsequent LA arc. A Decremental State Space Relaxation (DSSR) method is used to construct the lowest reduced cost elementary route during the pricing step of CG. We demonstrate that LA route based solvers can be used to efficiently tighten the standard set cover vehicle routing relaxation using a variant of subset row inequalities (SRI). However, SRI are difficult to use in practice as they alter the structure of the pricing problem in a manner that makes pricing difficult. SRI in their simplest form state that the number of routes servicing two or three members of a given set of three customers cannot exceed one. We introduce LA-SRI, which in their simplest form state that the number of LA arcs (in routes in the solution) including two or more members of a set of three customers (excluding the final customer of the arc) cannot exceed one. We exploit the structure of LA arcs inside a Graph Generation based formulation to accelerate convergence of CG. We apply our LA-SRI to CVRP and demonstrate that we tighten the LP relaxation, often making it equal to the optimal integer solution, and solve the LP efficiently without altering the structure of the pricing problem.


Authors: Amelia Regan, Udayan Mandal, Julian Yarkony
Recommended Citation:
Mandal, U., Regan, A., & Yarkony, J. (2022). Local Area Subset Row Inequalities for Efficient Exact Vehicle Routing. arXiv preprint arXiv:2209.12963.